Business Intelligence Dashboard
What is a Business Intelligence Dashboard?
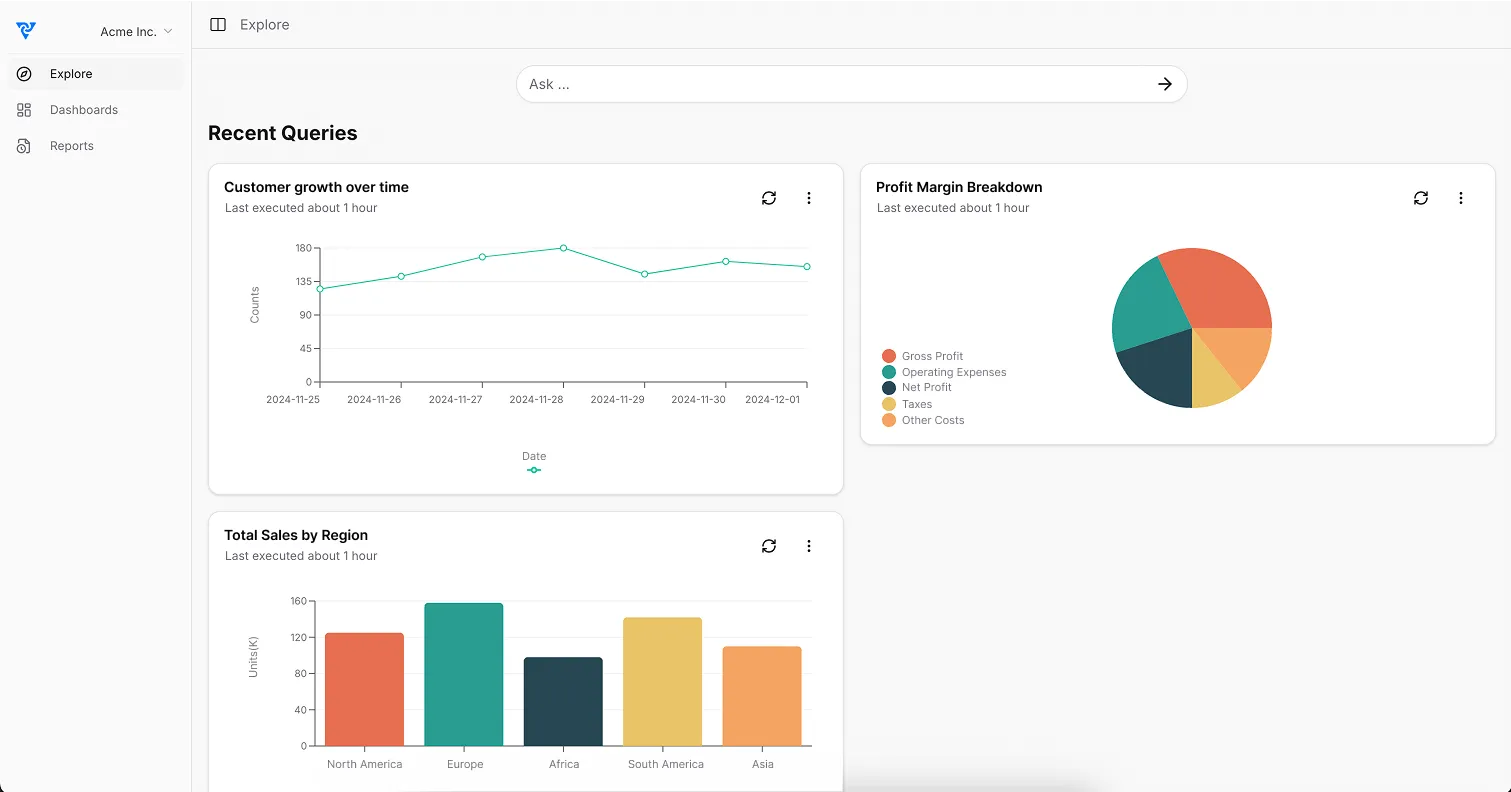
A Business Intelligence (BI) Dashboard provides a comprehensive view of business performance by aggregating data from various sources. It enables organizations to track key performance indicators (KPIs), analyze trends, and make data-driven decisions to drive growth and efficiency.
Why Use A Business Intelligence Dashboard?
- •Monitor real-time business performance across departments
- •Identify trends and insights to drive strategic decision-making
- •Visualize key metrics for sales, marketing, and operations
- •Enhance reporting efficiency with automated data collection
- •Improve resource allocation and optimize business workflows
What questions should a Business Intelligence Dashboard answer?
✦What are the current business trends?
Are revenue and customer acquisition rates increasing or declining?
✦Which areas of the business need improvement?
Are there operational inefficiencies affecting performance?
✦How are marketing campaigns performing?
Which campaigns generate the highest ROI?
✦What is the financial health of the business?
Are expenses aligned with revenue growth?
✦How can we optimize resource allocation?
Are teams and departments effectively utilizing available resources?
What metrics should I track in a Business Intelligence Dashboard?
Revenue Growth
Tracks revenue trends over time to assess business expansion and financial performance.
Customer Acquisition Cost (CAC)
Measures the cost of acquiring new customers to evaluate marketing efficiency.
Profit Margins
Analyzes gross and net profit margins to assess business profitability.
Sales Performance
Monitors sales volume, conversion rates, and pipeline performance.
Operational Efficiency
Tracks productivity metrics across different departments to optimize workflows.
Customer Retention Rate
Measures the percentage of returning customers to assess customer loyalty.
Ready to Optimize Your Business Intelligence Dashboard?
Start tracking real-time business insights and make data-driven decisions with a BI dashboard.
Create your BI DashboardOther BI Tools Worth Checking
A powerful data visualization tool for analyzing business performance.
Microsoft’s BI tool for real-time analytics and data visualization.
A data exploration platform for in-depth business intelligence reporting.
A cloud-based BI tool for connecting and visualizing business data in real time.