Feature-Specific Metrics Dashboard
What is a Feature-Specific Metrics Dashboard?
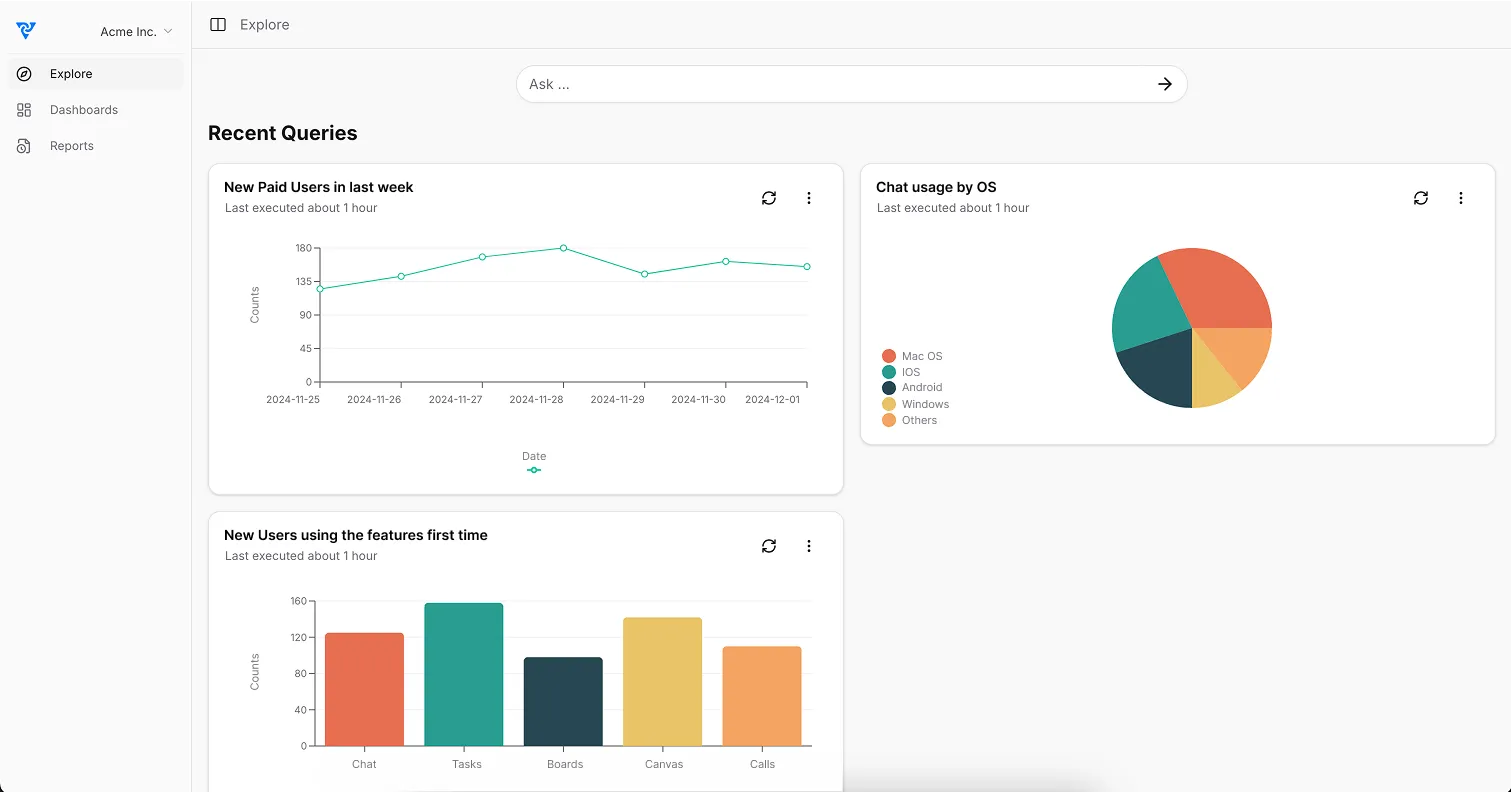
A Feature-Specific Metrics Dashboard helps businesses track and analyze how users interact with individual product features. By monitoring feature-level performance, teams can refine user experience, optimize engagement, and make data-driven improvements.
Why Use A Feature-Specific Metrics Dashboard?
- •Identify high-performing and underutilized features
- •Enhance user engagement by optimizing feature adoption
- •Measure the success of new feature releases
- •Reduce churn by pinpointing friction points
- •Make data-backed product decisions to improve usability
What questions should a Feature-Specific Metrics Dashboard answer?
✦Which features drive the most engagement?
Are users frequently watching the recommended videos on YouTube?
✦What friction points cause users to drop off?
Are users abandoning carts before completing an order on DoorDash?
✦How effective are new feature releases?
Did the latest Airbnb search update increase bookings?
✦Which features contribute most to retention?
Do users who engage with WhatsApp group chats stay on the platform longer?
What metrics should I track in a Feature-Specific Metrics Dashboard?
Feature Engagement Rate
Measure the percentage of active users who engage with a specific feature. A high engagement rate indicates that the feature adds value.
Conversion Rate per Feature
Track how many users complete a key action after using a feature, such as booking after using Airbnb’s search filter.
Time Spent per Feature
Analyze how long users interact with a feature—longer time may indicate high engagement or possible usability issues.
Drop-off Points in Feature Flow
Identify where users abandon a feature before completing an intended action, helping to improve the user experience.
Adoption Rate for New Features
Measure how quickly and widely new features are adopted across your user base.
Ready to Build Your Feature-Specific Metrics Dashboard?
Start tracking your key feature metrics and turn insights into action today.
Create your feature metrics dashboardTools for Tracking Feature-Specific Metrics
Best for analyzing user actions within specific features to understand adoption trends and engagement levels.
Ideal for tracking feature funnels and understanding behavior-driven feature usage insights.
Helpful for tracking feature engagement on web applications and identifying user flows.
Automatically captures user interactions with features for effortless tracking and analysis.
